SpaceX IPO Rocket Soars 20% in Public Debut. What Happens Next?SpaceX NASDAQ:SPCX finally arrived on the public markets, and the debut looked a lot like one of its Falcon rocket launches: loud, fast, and difficult to ignore.
Shares of Elon Musk’s space company surged 19% on their first day of trading Friday, closing at $160.95 after pricing at $135 in th

The best trades require research, then commitment.
Get started for free$0 forever, no credit card needed
See our space storyWith astronaut Scott "Kidd" Poteet
Space mission
Where the world does markets
Join 100 million traders and investors taking the future into their own hands.

Potential Value Play on Tesla: Massive Cup and Handle to $765Tesla is starting to look pretty interesting on the daily/weekly. There’s a possible massive cup-and-handle structure forming, with the neckline around $488.
If TSLA can break that level cleanly and HOLD the neckline, the measured move points towards the $764–$765 region over the longer term.
The

$MSFT — 200-Week EMA Test. What The Chart Says.Microsoft NASDAQ:MSFT is sitting at $390.74, touching the 200-week EMA for the first time since the 2022 low at $222. That prior test produced a 102% return before the next consolidation. The current setup is worth mapping clearly.
The chart structure
The 200-week EMA is now acting as dynamic sup

Macro Data Dashboard Review - June 2026With the economy seemingly in a perpetual state of uncertainty this decade, I have decided to make sense of it myself, so I can filter out editorial and political spin. I am sharing my dashboard as an Idea to provide a snapshot at the time of writing for future comparison. Some of these indicators a

Brent's April 17 Low Is Back in PlayOur Brent crude contract is testing the April 17 low at $82.10, marking another occasion when we saw a raft of "Hormuz open" headlines, including from Donald Trump. If energy traders feel the latest MOU may actually lead to a lasting peace, you'd imagine the price would break beneath it.
Should we

Why Will CrowdStrike Rule the AI Era?CrowdStrike continues to defy market gravity. The stock now trades above the $680 level after reaching highs near $785. Institutional investors now aggressively accumulate these cybersecurity shares. Why does this tech giant command such massive market influence? AI integration and hyperscale datace

Americold Realty Trust, IncAmericold Realty Trust, Inc. is one of the largest temperature-controlled warehouse and cold-storage real estate operators in the world. The company plays an important role in the global food supply chain by providing refrigerated storage, logistics, and distribution infrastructure for food producer

#LTC Ready for Short Term Recovery. Don't Miss This OpportunityYello, Paradisers! Is #Litecoin quietly building momentum for a powerful rally, or is the market preparing one final shakeout? Let's view #LTC trading setup:
💎#LTCUSDT is currently showing a constructive bullish structure on the 4H timeframe after successfully defending a key ascending support tren

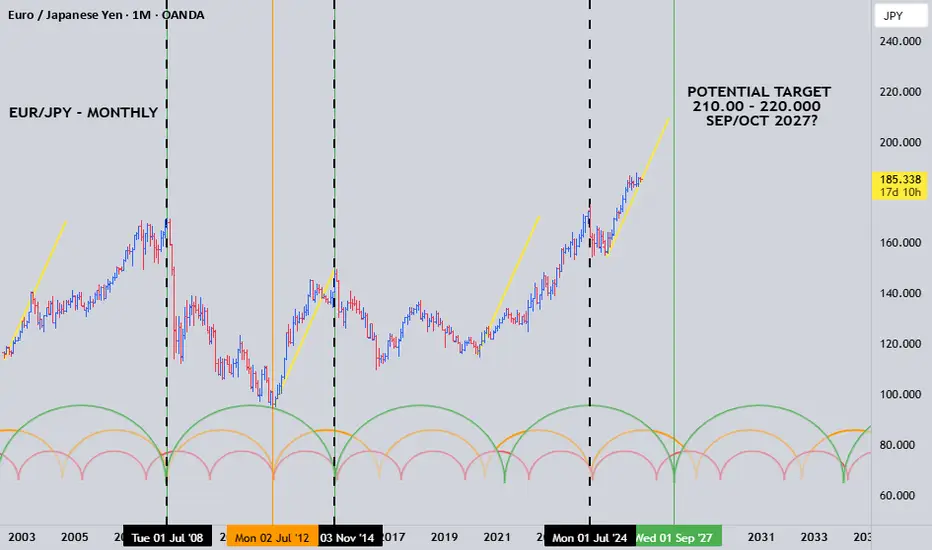
POSSIBLE EUR/JPY ROADMAP?On the Monthly chart of EUR/JPY you'll see three separate cycle brackets coloured Green, Red & Orange, all over different lengths of time, all highlighting major/minor High's & Low's of this market over a 24 year period of time.
The yellow lines highlight the measured moves and how the length of th
TradeCityPro | Bitcoin Daily Analysis #307👋 Welcome to TradeCityPro!
Let’s dive into the Bitcoin analysis. Today, the market is testing a very important resistance level.
⌛️ Time Frame: 1H
After finding support at 61,022, Bitcoin started a bullish move toward the 63,978 resistance level. Since reaching this area, price has entered a consol

See all editors' picks ideas
Session Edge Profiler | Flux ChartsGENERAL OVERVIEW:
The Session Edge Profiler is a statistical dashboard indicator that profiles up to five configurable trading sessions (Asia, London, NY AM, NY Lunch, NY PM by default) across the available completed trading days loaded on the chart. The indicator records each session's range, volu
Pine Script® indicator

Supertrend Parameter Sensitivity 3D [LuxAlgo]The Supertrend Parameter Sensitivity 3D indicator is a powerful optimization tool that executes 100 simultaneous Supertrend backtests bar-by-bar to visualize how different ATR Lengths and Multipliers impact performance across various metrics.
By projecting this data onto a 3D surface and a heatm
Pine Script® indicator

ExprLibExprLib is a library for parsing and evaluating string expressions. It allows scripts to expose configurable logic by letting users define custom conditions and calculations based on available data.
█ KEY FEATURES
• Rich expression support:
• Built-in constants (e.g., `10`, `2.5`, `5e-2`,
Pine Script® library

Chart Patterns Screener [Trendoscope]🎲 Overview
Chart Patterns Screener is an advanced Pine Script designed to automatically detect and display classical chart patterns on TradingView. It is a specialized, fine-tuned version of the popular Auto Chart Patterns indicator, optimized specifically for use with the Pine Screener.
🎲 H
Pine Script® indicator

Machine Learning RSI | AI Classification & Ranking (Zeiierman)█ Overview
The Machine Learning RSI | AI Classification & Ranking (Zeiierman) is an adaptive RSI intelligence system that combines momentum analysis, historical analog recognition, machine learning classification, confidence scoring, and dynamic trend management into a single framework.
Rather
Pine Script® indicator

Polynomial/Linear Regression Volume Profile [BigBeluga]Polynomial/Linear Regression Volume Profile is a state-of-the-art charting framework that blends advanced statistical modeling with localized volume distribution analysis. By evolving past traditional, static horizontal volume profiles, this indicator dynamically curves the volume profile matrix a
Pine Script® indicator

Whale Liquidity and Absorption Profile [AlgoAlpha]🟠 OVERVIEW
The Whale Liquidity and Absorption Profile maps intrabar buying, selling, delta, and absorption activity into stacked horizontal profiles. It samples lower timeframe volume data inside each chart candle, then groups that activity into price bins to show where aggressive participation and
Pine Script® indicator

Fractional EMA Kalman Filter [D7]Fractional EMA Kalman Filter
1. Description
Fractional EMA Kalman Filter is an experimental smoothing and state-estimation tool that combines a Kalman filter framework with a fractional EMA input. The objective is to create a filter that remains subdued during ranging conditions while retaini
Pine Script® indicator

Neural Weight Oscillator (Zeiierman)█ Overview
The Neural Weight Oscillator (Zeiierman) is an adaptive multi-factor oscillator that combines structured decision-making with dynamic market learning.
The script analyzes three core market behaviors: Trend, Mean Reversion, and Momentum. Instead of treating these components equally, t
Pine Script® indicator

NeuraLib: A Native AI and Deep Learning RuntimeNeuraLib is a tensor-based, auto-differentiating Machine Learning runtime built natively for Pine Script™.
It brings real Deep Learning mechanisms that power modern Artificial Intelligence systems into TradingView. Instead of relying on fixed formulas, static regressions, or rigid structures, Neur
Pine Script® library

See all indicators and strategies
Community trends
Netflix - This chart is soooo textbook!🎬Netflix ( NASDAQ:NFLX ) is soon testing major support:
🔎Analysis summary:
Literally since 2002, Netflix has been trading in a clear rising channel formation. And as we are speaking, Netflix is about to retest the lower support trendline. Together with the all time high break and retest and b

$ARCC – Bullish Range Compression Setting Up for BreakoutNASDAQ:ARCC – Bullish Range Compression Setting Up for Breakout
ARCC has completed a clean recovery after breaking out a bullish wedge pattern and is now consolidating in a well-defined range between $18.50 support and $19.40 resistance.
The price structure remains constructive as buyers continu

Here is why I am ultra bearish on $PLTR.Everyone seems to love this stock right now. That's exactly what worries me.
In this video, I'll explain why I think the downside risk is being massively underestimated.

SPCX Catalyst Overview and Ranking June 2026🚀 SpaceX (NASDAQ: SPCX) — Catalyst Ranking & Outlook
Updated: June 2026 | Post-IPO Debut Analysis
SpaceX completed the largest IPO in history on June 12, 2026, raising ~$75 billion at $135/share and debuting at $160.95 on Nasdaq under ticker SPCX — a 19.2% first-day pop from a $1.75 trillion valu

SPACEX Tests Support, Bounce Comming ?SPCX currently trading at a critical technical region after pulling back into the 0.618 Fibonacci retracement level, an area that often acts as a key support zone during broader bullish trends. Adding to the significance of this level is the presence of an open gap, creating a strong area of technic

SpaceX - the company which will be part of our portfolios!SPCX — Bullish Into the September Earnings Print, Then the Float Wall Arrives
This is a supply-and-demand story with a fixed calendar before it is a fundamentals story. The window to be long is defined by one thing: insiders cannot sell into the early tape, and the dates when they finally can are k

Took profits on RBLXNYSE:RBLX
In summary I go into great detail as to why I took profits looking at the SP:SPX NASDAQ:QQQ NASDAQ:NVDA

Intel Rose 200%+ in Six Weeks. Here's What Its Chart Says NowIntel NASDAQ:INTC has eased slightly recently, but hit an all-time high in May after an almost parabolic run that saw the stock gain 226.7% in six weeks. What do the chip designer/silicon foundry's chart and fundamentals say could happen next?
Let's take a look:
Intel's Fundamental Analysis
I

10x Genomics, Inc. — The Genetic comeback story no one’s talkingThe name alone implies exponential potential, 10x Genomics. Ironically, that’s exactly what the chart hints at, (resistances shown as horizontal black lines). After a brutal multi-year decline from its euphoric highs, TXG may now be on the cusp of a significant structural reversal.
The story
At t

AAPL: Swing Squeeze indicator has activated a bullish breakoutApple is currently on one of the indicators calculated support lines, the last time it was on a support line and the squeeze indicator activated it made some really nice runs for solid gains. NASDAQ:AAPL $314-320 target range.

See all stocks ideas
Today
KMXCarMax Inc
Actual
1.31
USD
Estimate
0.97
USD
Today
JBLJabil Inc.
Actual
—
Estimate
3.10
USD
Today
REPLReplimune Group, Inc.
Actual
—
Estimate
−0.71
USD
Today
CRWSCrown Crafts, Inc.
Actual
—
Estimate
—
Today
PODCPodcastOne, Inc.
Actual
—
Estimate
−0.02
USD
Today
CRMTAmerica's Car-Mart, Inc.
Actual
—
Estimate
−0.66
USD
Today
SBSafe Bulkers, Inc
Actual
—
Estimate
0.11
USD
Today
SWBISmith & Wesson Brands, Inc.
Actual
—
Estimate
0.23
USD
See more events
Community trends
BTCUSDT Recovery Continues Toward 69,500 Seller ZoneHello traders! Here’s my technical outlook based on the current BTCUSDT (4H) chart structure. BTCUSDT traded below a long-term descending trendline after breaking down from a consolidation range. Following a sharp decline, price found support inside the 65,300 Buyer Zone and formed a strong reversal

BTCUSDT Short: Rally Stalls at Supply, Pullback Before Next MoveHello traders! Here’s my technical outlook based on the current BTCUSDT (2H) chart structure. BTCUSDT previously traded inside a descending channel before breaking below support and extending its bearish move. After reaching a local bottom, price staged a recovery, but the rally has now approached a

Sharp Reversals Usually Begin With StabilityMost traders expect reversals to begin with violence.
They look for large rejection candles, sharp breakdowns, or aggressive spikes because those moments appear decisive and easy to identify. While dramatic reversals do happen, the true beginning of most trend changes is usually much quieter. Long b

ETHUSD – Bullish Setup...ETHUSD – Bullish Setup
📈 Market Bias: Bullish
🎯 Target 1: 1,845 – 1,865
First resistance zone
Consider partial profit here
🎯 Target 2: 1,975 – 2,000
Main target zone
Strong resistance area
🛡️ Support Zone: 1,750 – 1,770
A break below this zone may invalidate the bullish setup
✅ Price is holding abov

TradeCityPro | Bitcoin Daily Analysis #310👋 Welcome to TradeCityPro!
Let’s dive into the Bitcoin analysis. The market is still in an upward correction and has now reached the 67,322 level.
⌛️ Time Frame: 4H
After the bearish move that pushed Bitcoin down to 60,190, price managed to exit the oversold zone and started forming a corrective st

BITCOIN Did the BOJ just 'sign' another crash?The Bank of Japan (BOJ) just raised the Interest Rates by 25 basis points, matching expectations, bringing the key rate to its highest level in 31 years. So what does that have to do with Bitcoin (BTCUSD)?
Everything. There is a strong inverse correlation between BOJ rates rising and BTC. In the pa

BTCUSD Weekly Breakdown – Key Resistance at 87K
Bitcoin (BTCUSD) is currently moving within a well-defined market structure on the higher timeframe, showing clear reactions from major support and resistance zones. The price action indicates a broader bearish trend controlled by a descending trendline, where lower highs are consistently forming,

BTCUSD Resistance Rejection | Bears Target 63.8K & 59.4K.📊 BTCUSD (2H Timeframe)
🔍 Analysis:
• Price is testing a major resistance/supply zone near 67,000 ✅
• Market remains above the rising trendline and moving averages
• Rejection from resistance could trigger a correction toward support
🎯 Bearish Targets:
✅ TP1: 63,800 (1st Support)
✅ TP2: 59,400 (2

BTCUSDT Weekly Bullish Breakout Setup | Major Targets Ahead
Bitcoin (BTCUSDT) is showing signs of strength on the Weekly timeframe after reacting from a major demand zone and holding above long-term trendline support. The current structure suggests that buyers are defending key levels, while price continues to build momentum inside a bullish compression pa

Bitcoin (BTC): $40,000 or $100,000?Is ok to doubt? Are we justified in doubting?
Where is Bitcoin headed next? Are there any clues on this chart?
How to define a bearish or bullish chart setup? How to define a chart's potential?
How do I know if the potential of this chart is either bullish or bearish?
How are you feeling in this

See all crypto ideas
GOLD (XAU/USD) Short Trade Explained ⚠️GOLD opened with a nice gap yesterday. It is generally observed that approximately 80% of such gaps tend to be filled.
To trade this gap, we recommend monitoring the horizontal support level between 4300 and 4308. It is the neckline of a head and shoulders pattern.
A short position should be co

GOLD - Consolidation before growth. Positive background?ICMARKETS:XAUUSD is holding above $4,300 on Tuesday after pulling back from the six-day high of $4,369 reached during the previous U.S. trading session. The three-day rally has given way to consolidation, leaving room for further gains
Gold is currently in a phase of strong technical recovery, d

XAUUSD – Bearish Continuation Setup📊 XAUUSD – Bearish Continuation Setup
🔍 Market Overview
Gold remains under significant selling pressure after failing to reclaim a key resistance zone. Price is trading below the descending trendline and Ichimoku cloud resistance, indicating that sellers continue to dominate the market structure.

Gold Tests Buy-Side Liquidity Before Potential PullbackGold remains bullish after a strong breakout from the triangle structure and is currently trading inside a major buy-side liquidity zone. Price has swept liquidity above previous highs, increasing the probability of a short-term retracement before the next directional move.
The highlighted gap area

XAU/USD Bullish Continuation Eyes 4,405 Resistance TargetGold (XAU/USD) is maintaining a strong bullish structure after forming a base near the Fair Value Gap (FVG) support zone and breaking higher through a series of higher highs and higher lows. The market successfully filled the highlighted gap area and attracted fresh buying interest, leading to a sus

XAUUSDHello Traders! 👋
What are your thoughts on Gold?
Gold found strong support around the 4,000 zone, where buyers stepped in and triggered a meaningful rebound. In addition, improving geopolitical sentiment following peace developments in the Middle East has supported the current corrective recovery

XAUUSD Long: Will 4,300 Support Hold for a Rally to Supply 2?Hello traders! Here’s my technical outlook based on the current XAUUSD (1h) chart structure. XAUUSD previously traded below a descending resistance line before breaking below a consolidation range and extending its bearish move. After breaking down from a consolidation range, price hit a local botto

XAU/USD | Iran-U.S. Agreement Triggers Massive Gap In Gold! WhatBy analyzing the #Gold chart on the 4H timeframe, we can see that the market experienced a major shift after reports regarding a potential agreement between Iran and the United States. Gold opened the week with a massive gap around $4300 and has already rallied toward the $4369 region.
Although the

XAU/USD | Bearish Breaker retest - towards the supply zoneAs you can see in the 4H chart of Gold, after it swept the massive pool of liquidity below the 4098 level, it surged in price, going as high as 4369! With the positive news regarding the Deal and negotiations between US and IR, Gold opened this week with a very large gap, from 4218 to 4301! I expect

Gold 30Min Engaged ( Bullish Reversal Detected )HANZO MARKET LIQUIDITY REPORT
Gold
Timeframe: 30min (Volume Basis)
Scale: Higher Timeframe Context / Deep Volume analysis
━━━━━━━━━━━━━━━━━━━━━━
Market Observation
This analysis is focusing on structural behavior, liquidity zones, Volume analysis
and key areas of interest within the current range.

See all futures ideas
USDCHF Weekly CLS Nested in Monthly Hi Friends, New CLS Range has been created and Im looking for Long Model 1 trade setup. As always after the manipulation in to the Key Level, below the CLS range and reaction, we need to see a confirmation switch from the manipulation phase - CIOD (change in order flow) in the the expansion.
⏳ S

EURUSD at a Key Resistance – Will 1.1560 Be Retested?Hello traders! Here’s my technical outlook based on the current EURUSD (1H) chart structure. EURUSD previously traded inside a broad ascending channel, where price repeatedly reacted between the resistance and support lines. After failing to hold the lower boundary, the pair broke sharply lower, con

EURUSD Price Update – Clean & Clear ExplanationEUR/USD is showing bearish pressure after rejecting the strong resistance zone around 1.1610–1.1625. The market previously respected the bullish trendline and made higher highs, but recent price action indicates weakening bullish momentum. Sellers stepped in near the supply area, causing a pullback

AUDUSD is Nearing a Strong Resistance Line! Hey Traders, in today's trading session we are monitoring AUDUSD for a selling opportunity around 0.71200 zone, AUDUSD is trading in a downtrend and currently is in a correction phase in which it is approaching the trend at 0.71200 support and resistance area.
Trade safe, Joe.

GBP/USD Bearish BreakdownGBP/USD is showing bearish pressure after failing to sustain gains above the ascending channel structure. The pair faced rejection near the recent swing highs and has broken below the channel support, indicating a possible shift in momentum. Price is now approaching the first downside objective at *

EURUSD EURUSD has established a strong bullish market structure after sweeping liquidity below the recent lows and attracting significant buying interest from the demand zone.
Market Bias: Bullish Continuation Toward Buy-Side Liquidity
🎯 Target 1: 1.1620
🎯 Target 2: 1.1650+
Following the liquidity grab

EURUSD: Recovery in Progress - Resistance Comes Into PlayHello everyone, here is my breakdown of the current EURUSD setup.
Market Analysis
EURUSD previously traded inside a descending channel, where sellers maintained control after a prolonged decline. Following a breakout from the channel, price entered a consolidation range before finding support nea

GBP/USD Setup Favors Buyers as Uptrend Structure StrengthensThe GBP/USD 2-hour chart highlights a strong recovery following a bearish breakout from a prolonged consolidation zone. After breaking below the range and finding support in the lower demand area, buyers stepped in aggressively, driving price higher and forming a series of higher lows. The current s

CADJPY Trade Setup (1H Timeframe)CADJPY Trade Setup (1H Timeframe)
CADJPY is approaching a key intraday resistance zone around 114.300, where bearish momentum may continue to dominate. Traders should monitor price action closely for confirmation before entering any position.
Current Price Zone: 114.300
Technical Targets:
• Target

GBPUSD recovery underway defend key support levelGBP/USD is showing a strong bullish structure after successfully rebounding Buyers stepped in aggressively, driving price higher and breaking through several short-term resistance levels.
From a fundamental perspective, the recent upside movement may be supported by a softer U.S. Dollar, improving

See all forex ideas
Trade directly on Supercharts through our supported, fully-verified, and user-reviewed brokers.


