|
| 1 | +首发于:https://studygolang.com/articles/35253 |
| 2 | + |
1 | 3 | # 深入剖析 Golang Pprof 标签 |
2 | 4 |
|
3 | 5 | Polar Signals 提供的持续分析工具可以和任何格式的 pprof 分析适配,Go 深度集成了 [pprof](https://github.com/google/pprof) 甚至支持了它的`标签`特性。 |
4 | | -然而,自从我们发布了我们的 [持续分析产品](https://www.polarsignals.com/blog/posts/2021/02/09/announcing-polar-signals-continuous-profiler/) 之后, |
5 | | -收到了很多工程师的反馈,发现许多工程师不知道如何去分析, 或者不知道分析能给他们带来什么好处。这篇文章主要剖析 pprof 标签,并会结合一些 Go 的示例代码去分析。 |
| 6 | + |
| 7 | +然而,自从我们发布了我们的 [持续分析产品](https://www.polarsignals.com/blog/posts/2021/02/09/announcing-polar-signals-continuous-profiler/) 之后,收到了很多工程师的反馈,发现许多工程师不知道如何去分析, 或者不知道分析能给他们带来什么好处。这篇文章主要剖析 pprof 标签,并会结合一些 Go 的示例代码去分析。 |
6 | 8 |
|
7 | 9 | ## 基础 |
8 | 10 |
|
9 | | -pprof 标签只支持 Go 的 CPU 分析器。Go 的分析器是抽样分析,这意味着它只会根据特定的频率(默认是 1 秒钟 100 次)去获取执行中函数的调用栈并记录。 |
10 | | -简单来说,开发者如果使用标签,在分析器取样时就可以将函数的调用栈进行区分,然后只聚合i具有相同标签的函数调用栈。 |
| 11 | +pprof 标签只支持 Go 的 CPU 分析器。Go 的分析器是抽样分析,这意味着它只会根据特定的频率(默认是 1 秒钟 100 次)去获取执行中函数的调用栈并记录。简单来说,开发者如果使用标签,在分析器取样时就可以将函数的调用栈进行区分,然后只聚合具有相同标签的函数调用栈。 |
11 | 12 |
|
12 | 13 | Go 在 `runtime/pprof` 包中已经支持了标签检测,可以使用 [`pprof.Do`](https://golang.org/pkg/runtime/pprof/#Do) 函数非常方便的使用。 |
13 | 14 |
|
14 | 15 | ```golang |
15 | 16 | pprof.Do(ctx, pprof.Labels("label-key", "label-value"), func (ctx context.Context) { |
16 | | - // execute labeled code |
| 17 | + // execute labeled code |
17 | 18 | }) |
18 | 19 | ``` |
19 | 20 |
|
20 | 21 | ## 进阶 |
21 | 22 |
|
22 | | -为了进行演示如何使用 pprof |
23 | | -标签,我们创建了一个包含许多示例的仓库,这个示例仓库代码作为这篇文章的内容指导。 |
24 | | -仓库地址:[https://github.com/polarsignals/pprof-labels-example](https://github.com/polarsignals/pprof-labels-example) |
| 23 | +为了进行演示如何使用 pprof 标签,我们创建了一个包含许多示例的仓库,这个示例仓库代码作为这篇文章的内容指导。仓库地址:[https://github.com/polarsignals/pprof-labels-example](https://github.com/polarsignals/pprof-labels-example) |
25 | 24 |
|
26 | | -示例代码的 [`main.go`](https://github.com/polarsignals/pprof-labels-example/blob/60accf8b4fbebcd5f96b3743663af5745ef74596/main.go) |
27 | | -通过将 `tanant` 传递给 `iterate` 函数实现了大量的 for 循环, 其中`tanant1` 做了 10 亿次循环,而 `tanant2` 做了 1 亿次循环, |
28 | | -同时会记录 CPU 的分析日志并将其写入 `./cpuprofile.pb.gz`。 |
| 25 | +示例代码的 [`main.go`](https://github.com/polarsignals/pprof-labels-example/blob/60accf8b4fbebcd5f96b3743663af5745ef74596/main.go) 通过将 `tanant` 传递给 `iterate` 函数实现了大量的 for 循环, 其中`tanant1` 做了 10 亿次循环,而 `tanant2` 做了 1 亿次循环,同时会记录 CPU 的分析日志并将其写入 `./cpuprofile.pb.gz`。 |
29 | 26 |
|
30 | | -为了演示如何在 pprof 的分析日志中展示 pprof 标签, |
31 | | -用 [`printprofile.go`](https://github.com/polarsignals/pprof-labels-example/blob/60accf8b4fbebcd5f96b3743663af5745ef74596/printprofile.go) |
32 | | -来打印每次抽样函数调用栈以及样本值,还有收集到样本的标签。 |
| 27 | +为了演示如何在 pprof 的分析日志中展示 pprof 标签,用 [`printprofile.go`](https://github.com/polarsignals/pprof-labels-example/blob/60accf8b4fbebcd5f96b3743663af5745ef74596/printprofile.go) 来打印每次抽样函数调用栈以及样本值,还有收集到样本的标签。 |
33 | 28 |
|
34 | | -如果我们注释掉 [`pprof.Do` 的这部分](https://github.com/polarsignals/pprof-labels-example/blob/60accf8b4fbebcd5f96b3743663af5745ef74596/main.go#L39-L41) , |
35 | | -我们将无法进行标签检测,运行 [`printprofile.go`](https://github.com/polarsignals/pprof-labels-example/blob/60accf8b4fbebcd5f96b3743663af5745ef74596/printprofile.go) |
36 | | -代码,让我们看看没有标签的抽样分析结果: |
| 29 | +如果我们注释掉 [`pprof.Do` 的这部分](https://github.com/polarsignals/pprof-labels-example/blob/60accf8b4fbebcd5f96b3743663af5745ef74596/main.go#L39-L41) ,我们将无法进行标签检测,运行 [`printprofile.go`](https://github.com/polarsignals/pprof-labels-example/blob/60accf8b4fbebcd5f96b3743663af5745ef74596/printprofile.go) 代码,让我们看看没有标签的抽样分析结果: |
37 | 30 |
|
38 | 31 | ```bash |
39 | 32 | runtime.main |
@@ -94,88 +87,81 @@ map[tenant:[tenant2]] |
94 | 87 | Total: 2.82s |
95 | 88 | ``` |
96 | 89 |
|
97 | | -将所有抽样加起来总共花费了 2.82 秒,然而,因为调用 `iterate` 时,我们添加了标签,所以我们能在结果中区分哪个 `tenant` 导致了更多的 CPU 占用 。 |
98 | | -现在我们可以看到 `tenant1` 花费了总时间 2.82 秒中的 2.55 秒(2540000000ns + 10000000ns = 2550000000ns = 2.55s)。 |
| 90 | +将所有抽样加起来总共花费了 2.82 秒,然而,因为调用 `iterate` 时,我们添加了标签,所以我们能在结果中区分哪个 `tenant` 导致了更多的 CPU 占用。现在我们可以看到 `tenant1` 花费了总时间 2.82 秒中的 2.55 秒(2540000000ns + 10000000ns = 2550000000ns = 2.55s)。 |
99 | 91 |
|
100 | 92 | 让我们看看抽样的原始日志(还有它们的元数据),去更深入理解一下它们的格式: |
101 | 93 |
|
102 | 94 | ```bash |
103 | 95 | $ protoc --decode perftools.profiles.Profile --proto_path ~/src/github.com/google/pprof/proto profile.proto < cpuprofile.pb | grep -A12 "sample {" |
104 | 96 | sample { |
105 | | - location_id: 1 |
106 | | - location_id: 2 |
107 | | - location_id: 3 |
108 | | - location_id: 4 |
109 | | - location_id: 5 |
110 | | - value: 1 |
111 | | - value: 10000000 |
| 97 | + location_id: 1 |
| 98 | + location_id: 2 |
| 99 | + location_id: 3 |
| 100 | + location_id: 4 |
| 101 | + location_id: 5 |
| 102 | + value: 1 |
| 103 | + value: 10000000 |
112 | 104 | } |
113 | 105 | sample { |
114 | | - location_id: 1 |
115 | | - location_id: 2 |
116 | | - location_id: 3 |
117 | | - location_id: 4 |
118 | | - location_id: 5 |
119 | | - value: 254 |
120 | | - value: 2540000000 |
121 | | - label { |
122 | | - key: 14 |
123 | | - str: 15 |
124 | | - } |
| 106 | + location_id: 1 |
| 107 | + location_id: 2 |
| 108 | + location_id: 3 |
| 109 | + location_id: 4 |
| 110 | + location_id: 5 |
| 111 | + value: 254 |
| 112 | + value: 2540000000 |
| 113 | + label { |
| 114 | + key: 14 |
| 115 | + str: 15 |
| 116 | + } |
125 | 117 | } |
126 | 118 | sample { |
127 | | - location_id: 6 |
128 | | - location_id: 2 |
129 | | - location_id: 3 |
130 | | - location_id: 4 |
131 | | - location_id: 5 |
132 | | - value: 1 |
133 | | - value: 10000000 |
134 | | - label { |
135 | | - key: 14 |
136 | | - str: 15 |
137 | | - } |
| 119 | + location_id: 6 |
| 120 | + location_id: 2 |
| 121 | + location_id: 3 |
| 122 | + location_id: 4 |
| 123 | + location_id: 5 |
| 124 | + value: 1 |
| 125 | + value: 10000000 |
| 126 | + label { |
| 127 | + key: 14 |
| 128 | + str: 15 |
| 129 | + } |
138 | 130 | } |
139 | 131 | sample { |
140 | | - location_id: 1 |
141 | | - location_id: 2 |
142 | | - location_id: 3 |
143 | | - location_id: 7 |
144 | | - location_id: 5 |
145 | | - value: 26 |
146 | | - value: 260000000 |
147 | | - label { |
148 | | - key: 14 |
149 | | - str: 16 |
150 | | - } |
| 132 | + location_id: 1 |
| 133 | + location_id: 2 |
| 134 | + location_id: 3 |
| 135 | + location_id: 7 |
| 136 | + location_id: 5 |
| 137 | + value: 26 |
| 138 | + value: 260000000 |
| 139 | + label { |
| 140 | + key: 14 |
| 141 | + str: 16 |
| 142 | + } |
151 | 143 | } |
152 | 144 | ``` |
153 | 145 |
|
154 | | -我们可以看到每个抽样都由许多 ID 组成,这些 ID 指向它们在分析日志 `location` 数组中的位置,除了这些 ID 还有几个值 。 |
155 | | -仔细看下 `printprofile.go` 程序,你会发现它使用了每个抽样的最后一个抽样 value。 |
156 | | -实际上,Go 的 CPU 分析器会记录两个 value,第一个代表这个调用栈在一次分析区间被记录样本的数量,第二个代表它花费了多少纳秒。 |
157 | | -pprof 的定义描述当没设置 `default_sample_type` 时(在 Go 的 CPU 配置中设置),就使用所有 value 中的最后一个, |
158 | | -因此我们使用的是代表纳秒的 value 而不是样本数的 value。最后,我们可以打印出标签,它是 pprof 定义的一个以字符串组成的字典。 |
| 146 | +我们可以看到每个抽样都由许多 ID 组成,这些 ID 指向它们在分析日志 `location` 数组中的位置,除了这些 ID 还有几个值。仔细看下 `printprofile.go` 程序,你会发现它使用了每个抽样的最后一个抽样 value。实际上,Go 的 CPU 分析器会记录两个 value,第一个代表这个调用栈在一次分析区间被记录样本的数量,第二个代表它花费了多少纳秒。pprof 的定义描述当没设置 `default_sample_type` 时(在 Go 的 CPU 配置中设置),就使用所有 value 中的最后一个,因此我们使用的是代表纳秒的 value 而不是样本数的 value。最后,我们可以打印出标签,它是 pprof 定义的一个以字符串组成的字典。 |
159 | 147 |
|
160 | 148 | 最后,因为用标签去区分数据,我们可以让可视化界面更直观。 |
161 | 149 |
|
162 | 150 | 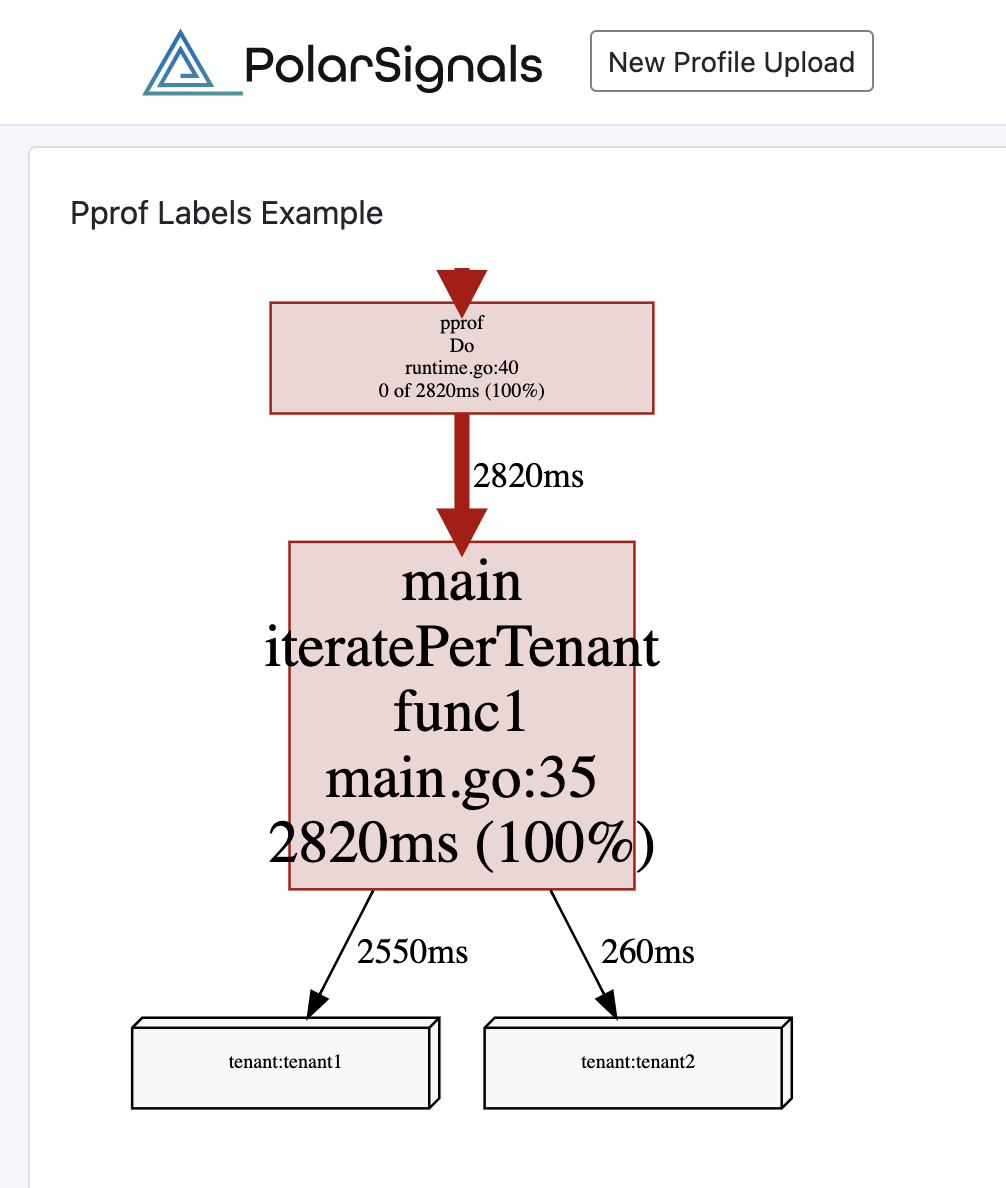 |
163 | 151 |
|
164 | | -你可以在 Polar Signals 网站去更详细的了解上面的这次分析:[https://share.polarsignals.com/2063c5c/](https://share.polarsignals.com/2063c5c/) |
| 152 | +你可以在 Polar Signals 网站去更详细的了解上面的这次分析:[https://share.polarsignals.com/2063c5c/](https://share.polarsignals.com/2063c5c/)。 |
165 | 153 |
|
166 | 154 | ## 结论 |
167 | 155 |
|
168 | | -pprof 标签是帮助我们理解程序不同执行路径非常有用的方法,许多人喜欢在多租户系统中使用它们,目的就是为了能够定位在他们系统中出现的由某一个租户导致的性能问题。 |
169 | | -就像开头说的,只需要调用 [`pprof.Do`](https://golang.org/pkg/runtime/pprof/#Do) 就可以了。 |
| 156 | +pprof 标签是帮助我们理解程序不同执行路径非常有用的方法,许多人喜欢在多租户系统中使用它们,目的就是为了能够定位在他们系统中出现的由某一个租户导致的性能问题。就像开头说的,只需要调用 [`pprof.Do`](https://golang.org/pkg/runtime/pprof/#Do) 就可以了。 |
170 | 157 |
|
171 | | -Polar Signals 提供的持续分析工具也支持了 pprof 标签的可视化界面和报告, |
172 | | -如果你想参与个人体验版请点击:[申请资格](https://www.polarsignals.com/#request-access) |
| 158 | +Polar Signals 提供的持续分析工具也支持了 pprof 标签的可视化界面和报告,如果你想参与个人体验版请点击:[申请资格](https://www.polarsignals.com/#request-access)。 |
173 | 159 |
|
174 | 160 | --- |
175 | 161 | via: https://www.polarsignals.com/blog/posts/2021/04/13/demystifying-pprof-labels-with-go/ |
176 | 162 |
|
177 | 163 | 作者:[Frederic Branczyk](https://twitter.com/fredbrancz) |
178 | 164 | 译者:[h1z3y3](https://h1z3y3.me) |
179 | | -校对:[校对者ID](https://github.com/校对者ID) |
| 165 | +校对:[polaris1119](https://github.com/polaris1119) |
180 | 166 |
|
181 | 167 | 本文由 [GCTT](https://github.com/studygolang/GCTT) 原创编译,[Go 中文网](https://studygolang.com/) 荣誉推出 |
0 commit comments