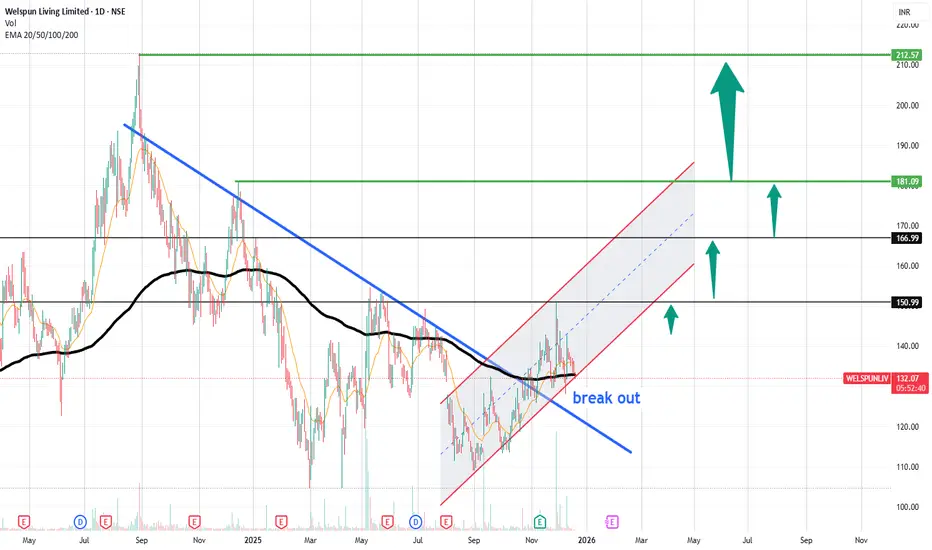
WELSPUNLIV | Trend Reversal with Strong VolumeWelspun Living Ltd. (NSE: WELSPUNLIV) is showing signs of a significant trend reversal as it breaks out of a downward channel, supported by a surge in volume. After multiple attempts to move higher, the price action has finally broken above the crucial resistance at ₹132.90, signaling the potential for an uptrend. Here’s the breakdown:
Breakout Point: The price has broken out of a downward trend channel (highlighted in blue), which could signal the start of a bullish phase.
Key Support: The breakout level around ₹132.90 will act as a key support, and any pullbacks towards this level can be considered as potential buying opportunities.
Level 1 - ₹150.99: The first resistance is at ₹150.99. A successful breakout above this level will confirm the uptrend.
Level 2 - ₹166.99: The next major resistance is ₹166.99, which will likely act as a significant hurdle.
Level 3 - ₹181.09: If momentum continues, the price could reach ₹181.09, where another resistance zone exists.
Ultimate Level - ₹212.57: If the bullish trend continues, the price could eventually reach ₹212.57, the next major resistance zone.
Volume Confirmation: The breakout is accompanied by a notable increase in volume, which enhances the reliability of this move.
Note: This analysis is purely for educational purposes and is not a recommendation to buy or sell any securities. It is based on technical indicators and historical price action. Always conduct your own research or consult a financial advisor before making any investment decisions. Use proper risk management techniques, such as stop-loss orders, when trading. The market is unpredictable, and past performance does not guarantee future results.
Community ideas
BSOFT: Primary downtrend with early signs of a short-term revers
Price Structure:
The stock is in a descending channel from the previous peak (~₹880–900 zone).
Recently, price has bounced from the major demand zone near ₹380–400, forming a higher low.
A trendline breakout attempt is visible, with price closing above the short-term falling trendline.
Key Levels (as per chart):
Immediate Support: ₹400–410
Major Support: ₹380–390 (strong base / demand zone)
Immediate Resistance: ₹435–445
Major Resistance Zones:
₹475–485
₹520–540
₹600–620 (Fibonacci & structure resistance)
Fibonacci Analysis:
Price rebounded from the 0.786–0.886 retracement zone, indicating strong buying interest.
Current price is testing the 0.236–0.382 retracement band, which acts as a supply zone.
Moving Average:
Price has moved above the short-term moving average (yellow MA), suggesting improving momentum.
Sustained trading above this MA will strengthen the bullish case.
Volume:
Recent bounce is supported by higher volume, indicating accumulation near the lows.
MACD:
MACD shows a bullish crossover and rising histogram, signaling positive momentum and potential trend reversal.
Outlook:
Bullish above ₹435 with targets at ₹475 → ₹520.
Failure below ₹400 may lead to retesting ₹380 support.
Overall bias remains cautiously bullish unless price re-enters the falling channel.
Trading View Summary:
BSOFT is showing early reversal signals from a strong support zone after a prolonged downtrend. Trendline breakout, bullish MACD, and volume expansion favor an upside move, though confirmation above ₹445 is crucial.

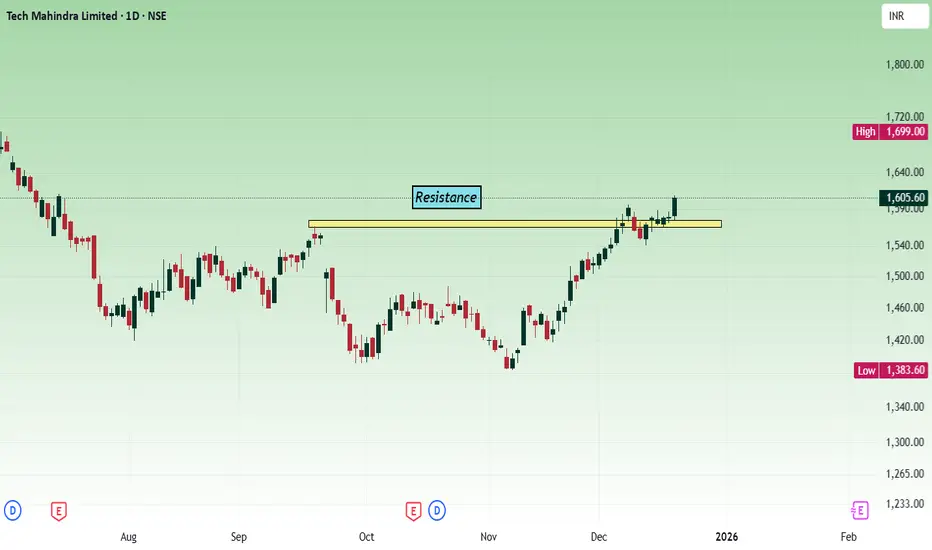
TechM - Multi time frame analysisThe price has broken the resistance at the 1560 - 1580 zone, unable to sustain, fall back and once again took support. Today's movement shows bullish strength.
As per the daily chart, the price has broken the trend line. Strong weekly close will confirm the bullish movement.
Buy above the 1595 - 1602 zone with the stop loss of 1580 for the targets 1616, 1630, 1648 and 1662. This analysis is for the short term.
Price should show bullish strength at the 1580 - 1600 zone. Watch how the price is showing the strength before taking any trade.
As same As Expected easily gives 1:3 RR guysAs I told you in previous post after getting medicated this Demand zone with perfect candelstick conformation and LTF conformation go long As you can see market easily gave us 1:3 Risk Reward
Enjoy your profits Guys
Follow me for more

BANKNIFTY at a Make-or-Break ZoneNIFTYBANK is currently trading at a critical confluence zone where a downward-sloping resistance trendline is meeting a well-defined rising support area on the 1-hour timeframe. This price compression indicates indecision and typically precedes a sharp directional move. The index has repeatedly respected both these levels, confirming their importance in the current structure.
On the upside, the falling resistance zone near 59,300–59,500 remains the key hurdle. A sustained breakout and close above this trendline would signal a shift in short-term momentum, opening the door for a recovery move toward 59,800 initially, followed by a potential extension toward the 60,400–60,600 zone. Such a breakout would also indicate that buyers are regaining control after the recent corrective phase.
On the downside, the green support zone around 58,700–58,850 is the immediate demand area to watch. This zone has acted as a base multiple times, and as long as Bank Nifty holds above it, pullbacks may continue to attract buyers. However, a decisive breakdown below this support would invalidate the bullish bounce scenario and could accelerate selling pressure toward 58,300 first, with a deeper downside extension possible toward the 57,200 region.
Overall, BANKNIFTY is trading inside a tightening range, signaling an imminent volatility expansion. Directional clarity will emerge only after a confirmed breakout or breakdown. Traders should remain cautious at current levels and wait for confirmation, as this is a classic decision zone where false moves are also common.

CHFJPY – Bias-Driven HFT Buy OpportunityThis my first Idea I share in public. Bias-driven HFT buy on CHFJPY, aligned with the higher-timeframe Monthly bullish structure. Price is holding above key support and reacting from a discount zone. Entry is taken in line with structure continuation, with SL below the current daily candle and targets toward the next high maybe in next month. Risk is defined and managed as per plan.

XAU/USD Outlook TodayThe latest data paints a pretty clear picture of where XAU/USD stands today, and the market tone is cautious but still bullish overall.
## 🟡 XAU/USD Outlook Today
### 1. **Price Action & Market Mood**
Gold is trading around the **$4,300** zone, with traders showing hesitation ahead of key U.S. economic data releases. This pause is driven mainly by expectations around inflation and jobs numbers, which could shift Federal Reserve rate‑cut expectations.
- Gold recently eased slightly as traders took profits and reduced exposure ahead of U.S. jobs data.
- The metal is still holding above the **50‑day moving average at $4,127**, keeping the broader uptrend intact.
### 2. **Key Levels to Watch**
- **Resistance:**
- **$4,353–$4,381** remains a strong ceiling where recent rallies have stalled.
- **Support:**
- **$4,127** (50‑day MA) is the key line that keeps the “buy‑the‑dip” bias alive.
### 3. **Macro Drivers Today**
Markets are waiting for:
- **U.S. CPI data**, expected around **3.1% headline** and **3.0% core**. This is the biggest catalyst for gold today.
- A softer CPI print could weaken the dollar and push gold higher; a hotter print could pressure gold.
### 4. **Short‑Term Forecast**
Based on current sentiment and technicals:
- **Bias:** Mildly bullish
- **Expected range:** **$4,260 – $4,350**
- **Breakout potential:** A close above **$4,353** could open the door to retesting the **$4,381** record area.
If you want, I can also give you:
- A **1‑hour intraday technical setup**
- A **swing‑trade plan**
- Or **automated chart levels** based on your trading style

BTCUSD: Holding Wave X or Slipping Lower?24 Nov 2025
27 Nov 2025
1 Dec 2025
17 Dec 2025
Bitcoin is still trading inside a falling channel, and the overall structure remains corrective. The recent bounce from lower levels lacks momentum and is overlapping, which signals consolidation rather than a trend reversal. Price continues to respect channel resistance, keeping the broader bias weak.
Wave X is acting as an important support zone around 83,822 , and as long as price holds above this level, further consolidation remains possible. This area is currently absorbing selling pressure and preventing immediate continuation to the downside.
However, a decisive breakdown below Wave X would signal that the correction is not complete. In that scenario, downside momentum is likely to expand, opening the path toward the 79,650 - 75,655 zone.
Stay Tuned
@Money_Dictators
RD :)

HEROMOTOCO - Rejection From Strong Resistance, Momentum Cooling💹 Hero MotoCorp Ltd (NSE: HEROMOTOCO)
Sector: Automobiles | CMP: 5817
View: Bearish — Rejection From Strong Resistance, Momentum Cooling
HEROMOTOCO has recently faced a sharp rejection from its upper resistance zone near the 6100–6200 region after a strong prior rally, indicating supply emergence at higher levels rather than healthy consolidation. The subsequent decline has been decisive, with price slipping back below key short-term levels, suggesting that the recent upswing may have been a momentum-driven leg rather than the start of a sustained trend. Current price behaviour reflects a cooling phase following distribution near the highs.
From a structural perspective, the stock remains within a broader developing framework, but near-term momentum has weakened. RSI around 42.6 sits in a neutral-to-healthy zone, indicating that the stock is neither oversold nor displaying reversal exhaustion. Stochastic has cooled from elevated levels, while MACD signals point to loss of bullish momentum rather than aggressive bearish acceleration. ADX suggests the trend is still developing, though recent behaviour highlights a transition from expansion to consolidation or pullback.
Volume participation remains moderate (Vol-X ~0.83), confirming that the recent decline is orderly and controlled, not panic-driven. This reduces the probability of sharp capitulation but keeps downside risk open as long as price fails to reclaim overhead supply. The current structure favours patience, with markets reassessing value after a strong prior move.
Key price references show strong overhead resistance clustered near 5931–6045 and further up around 6120, while immediate structural supports are placed near 5742, followed by 5668 and 5553, defining the current risk-reward envelope. Sustained acceptance above the resistance band would be required to restore bullish confidence, while continued trade below this zone keeps the bias tilted to the downside or range-bound with elevated volatility.
On the derivatives side, near-ATM CALLs and PUTs are referenced strictly for analytical insight into positioning behaviour. CALL-side data shows rising open interest with moderate volume expansion, indicating short build-up rather than directional strength, while PUT-side activity reflects short-covering-led participation, suggesting defensive repositioning rather than fresh aggressive bearish bets. Implied volatility remains in a relatively low-to-moderate band, pointing to measured risk pricing rather than fear-driven expansion. Overall, derivatives behaviour aligns with a cooling, non-trending phase, where conviction remains mixed and momentum-dependent.
Structure quality metrics reflect this balance. The STWP Edge Score in the moderate range highlights tradability but not high-conviction trend alignment. Liquidity remains concentrated near ATM strikes, supporting participation, but directional option structures remain sensitive to time decay and price stalling, reinforcing the importance of confirmation through price acceptance or rejection at key levels.
Overall, HEROMOTOCO is currently in a post-rally digestion phase, with bearish pressure emerging near resistance and momentum moderating. While deeper downside is possible if supports fail, the absence of capitulation volume suggests that the stock may oscillate within a defined range unless fresh directional conviction develops.
Final Outlook (Educational Snapshot):
Momentum: Neutral| Trend: Developing / Cooling | Risk: Low | Volume: Normal
⚠️ STWP Legal Disclaimer
This document is strictly for educational and informational purposes. All examples, charts, levels, and option structures discussed are illustrative and are not intended as buy, sell, or hold recommendations. STWP does not provide investment advice, trading tips, signals, or personalized financial guidance of any kind, nor is it a SEBI-registered intermediary or research analyst. The analyses, illustrations, and risk–reward structures included here are generic in nature and based on publicly available data and observed market behaviour, which may change without notice. Financial markets involve significant risk; derivatives in particular carry the potential for substantial losses. Option premiums, implied volatility, open interest, delta, and other market variables can fluctuate rapidly and unpredictably.
Readers are solely responsible for their trading decisions, capital management, and risk assessment. Before making any investment or trading decision, please consult a SEBI-registered investment advisor. STWP, its representatives, and affiliates shall not be liable for any direct or indirect loss arising from the use of this material. Historical patterns or past market behaviour do not guarantee future outcomes, nor should any part of this document be interpreted as a promise of performance, accuracy, or returns.
Position Status: No active position in this instrument at the time of analysis.
Data Source: TradingView & NSE India.
💬 Found this useful?
🔼 Boost this post to support structured learning
✍️ Share your thoughts or questions in the comments
🔁 Forward this to traders who value clean technical studies
👉 Follow for disciplined, structured, STWP-style analysis
🚀 Stay Calm. Stay Clean. Trade With Patience.
Trade Smart | Learn Zones | Be Self-Reliant 📊

NIFTY: Structure Is Clear, Entry Comes With ConfirmationNIFTY is currently trading inside a well-defined structure, where price is moving between key support and a declining trendline. This zone often creates noise, fake moves, and emotional entries.
Instead of forcing trades in the middle, the focus should be on waiting:
• Either for a clear rejection from resistance
• Or a confirmed breakout with acceptance
Entries taken without confirmation usually come from impatience, not edge.
The market will always give another opportunity — but capital and confidence must be protected first.
I prefer waiting for price to reach important levels and show intent, rather than reacting to every small move.

EURUSD-Short-15MThe trade was initiated based on a high-probability setup identified through a confluence of technical factors.
Higher Timeframe (HTF) Analysis: Price action on a higher timeframe (15 MIn) demonstrated a perfect retracement into a previously identified order block (OB). This order block represented an area of significant institutional selling pressure (bearish OB) that had yet to be fully mitigated.
Lower Timeframe (LTF) Confirmation: A shift to a 1-minute chart was utilized to refine the entry and gain further confirmation of the HTF bias, a technique used for precise entry and risk control.
Point of Interest (POI) Entry: A precise entry was executed upon the price reaching a specific Point of Interest (POI) within the order block zone, confirming institutional activity at that exact level.
Risk Management & Target:
Risk: A stop-loss order was strategically placed above the high of the order block, defining the maximum risk and invalidation point for the trade.
Reward: The profit target was set at the next key level of Sell-side Liquidity (SSL), located below recent swing lows, where a cluster of stop-loss orders was anticipated to reside.

NIFTY Levels for Today
Here are the NIFTY's Levels for intraday (in the image below) today. Based on market movement, these levels can act as support, resistance or both.
Please consider these levels only if there is movement in index and 15m candle sustains at the given levels. The SL (Stop loss) for each BUY trade should be the previous RED candle below the given level. Similarly, the SL (Stop loss) for each SELL trade should be the previous GREEN candle above the given level.
Note: This idea and these levels are only for learning and educational purpose.
Your likes and boosts gives us motivation for continued learning and support.

XAUUSD | 1H | Liquidity-Based SetupPrice is currently trading inside a well-defined range, with liquidity clearly resting on both sides.
• The equal highs / range high above act as buy-side liquidity, likely to be raided before any meaningful directional move.
• A liquidity sweep to the upside is expected first, tapping into premium pricing and inducing late buyers.
• Post sweep, watch for shift in market structure on LTF, indicating smart money distribution.
• Downside targets align with the HTF demand / discount zone, where unmitigated liquidity rests.
Execution Plan
No blind entries
Entry will be taken only if LTF confirms reversal after liquidity grab, in alignment with HTF narrative
Targeting a range expansion → distribution → markdown sequence
This is a classic liquidity engineering setup, not a breakout trade.

XAUUSD is ranging before CPI direction comes after the news.Gold is currently consolidating sideways near the upper zone around 434x as the market awaits inflation data and updates from the BOJ. Short-term volatility may occur, but the overall structure remains intact, with no clear breakout signal seen in the previous session.
Before the news, the preferred strategy is to trade within the range. Traders can look for reaction setups when price approaches 4346–4348, with a mandatory stop-loss, as this area has been tested multiple times.
After the news is released, the market is expected to choose a new direction. If price breaks and holds firmly above the 435x zone, the bullish trend will be confirmed. In that case, the focus shifts to buying the breakout, with targets toward the previous high and potentially a new ATH.
👉 Before the news: trade the range – react at key levels.
👉 After the news: wait for confirmation – follow the trend.

Nifty 1hrs timeframe wave analysis Nifty 1hrs time frame wave analysis.
Nifty trades in corrective waves as WXYXZ. The WXYX wave has completed and the Z wave is in progress. Price will trade below 25946 until it breaks the previous low of 25700 and completes the Z wave here. As soon as the complex correction is complete, a new impulse wave will emerge from here and create a new high.
Thanks
MKT Learner
Disclaimer
Here is my analysis, which I am sharing for educational purposes only

BitcoinBitcoin is currently trading in a clear downtrend on the daily timeframe. The chart shows a sequence of lower highs and lower lows, highlighted by repeated rising trendlines that break to the downside, confirming bearish continuation.

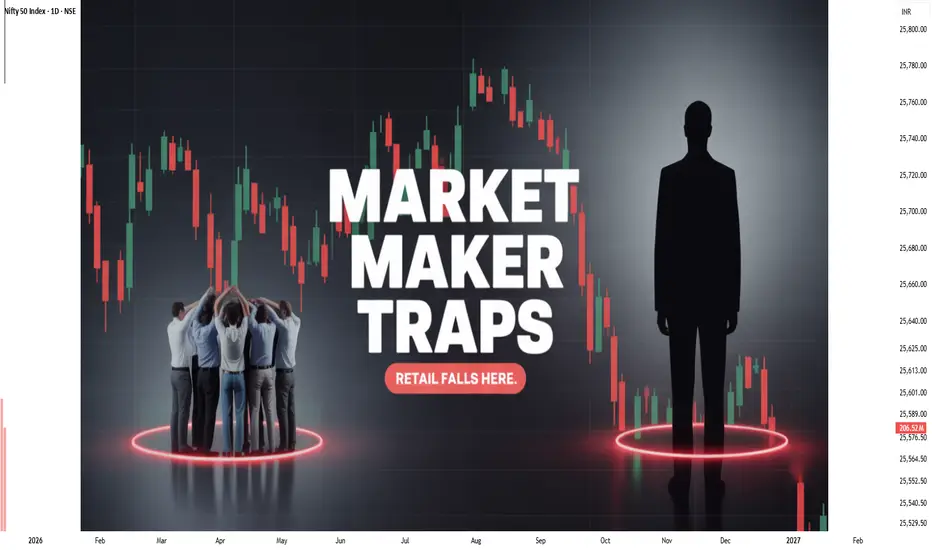
How Market Makers Trap Retail Traders & How to Avoid It?Hello Traders!
Have you ever taken a perfect-looking trade, only to see price hit your stop loss and then move exactly in your direction?
You felt unlucky.
You blamed manipulation.
You thought the market was against you.
But here’s the uncomfortable truth.
Most retail traders don’t lose because their setup is bad.
They lose because they don’t understand how market makers operate.
Once you understand how traps are created, your entire way of reading charts changes.
Who Are Market Makers (In Simple Words)?
Market makers are not sitting there to hunt you personally.
Their job is to provide liquidity and execute large orders.
To do that, they need one thing from the market.
Orders.
Stop losses, breakout entries, panic exits, all of these are liquidity.
Common Ways Retail Traders Get Trapped
False Breakouts
Price breaks an obvious high or low.
Retail traders jump in expecting a strong move.
Within a few candles, price reverses sharply and traps them.
Stop-Loss Hunts
Price suddenly spikes just enough to take out stop losses placed below support or above resistance.
Once liquidity is collected, price moves in the opposite direction.
Emotional Candles
Big red or green candles appear after news or during high volatility.
Retail reacts emotionally.
Market makers use this emotion to fill positions.
Choppy Ranges
Price keeps moving up and down inside a range, stopping out both buyers and sellers.
Retail overtrades.
Smart money accumulates quietly.
If this feels familiar, don’t worry.
Almost every trader learns this the hard way.
Why Retail Traders Fall Into These Traps
They chase obvious levels that everyone can see.
They place predictable stop losses at exact highs and lows.
They trade based on excitement instead of structure.
They react instead of waiting for confirmation.
Market makers don’t need to predict the future.
They simply exploit predictable behavior.
How I Avoid Market Maker Traps
This part changed my trading completely.
I Stop Chasing Breakouts
If a level looks too obvious, I wait.
Real moves usually come after trapping traders, not before.
I Wait for Confirmation
I look for price to break a level and then fail.
False moves often reveal real direction.
I Respect Liquidity Zones
Highs, lows, equal highs, equal lows, these are liquidity pools.
I expect reactions there, not blind continuation.
I Trade With Calm, Not Urgency
When I feel FOMO, I know I’m late.
Good trades never force you emotionally.
Trading became much easier once I stopped trying to be right and started trying to be patient.
The Biggest Mindset Shift
The market’s job is not to be fair.
Your job is not to be emotional.
Once you accept this, traps stop hurting you.
Sometimes you even start using them to your advantage.
Rahul’s Tip
If price does something that feels “too obvious,” pause.
Ask yourself one question
“Who benefits if retail enters here?”
That single question has saved me from many bad trades.
Conclusion
Market maker traps are not a conspiracy.
They are a result of human psychology and predictable behavior.
When you stop reacting and start observing,
the market stops feeling random and starts making sense.
If this post helped you see traps differently, like it, share your thoughts in the comments, and follow for more real-world trading psychology content.
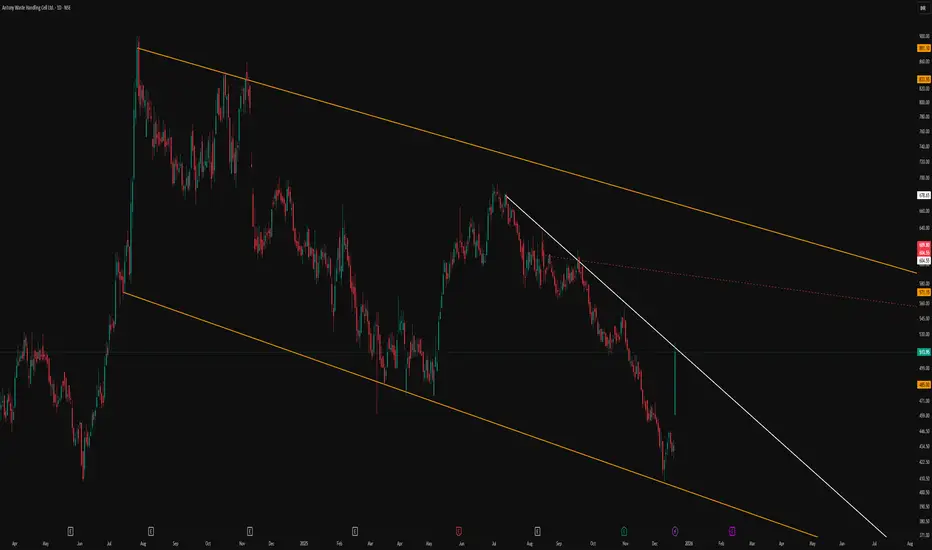
Classic Descending Channel With Clear Structural LevelsThe primary feature of this chart is the broad descending parallel channel marked by the orange lines, which frames the entire corrective phase in a neat, orderly manner. Price has repeatedly respected both the upper and lower boundaries, reinforcing the relevance of this channel as a dominant structure.
A trend‑changing resistance line is drawn in white, connecting swing highs and visually separating the prevailing downtrend from any potential shift in behavior. This line serves as a clear reference for how price has reacted to supply zones within the channel, without implying any future breakout or directional bias.
The red dotted line acts as an internal, hidden line derived from prior price interaction, helping to map out the internal rhythm of the move. Overall, the chart is intended purely as a structural illustration of how price respects channels and internal reference lines, without any forecast or trade signal.
NIFTY : Trading levels and Plan for 19-Dec-2025📘 NIFTY Trading Plan for 19-Dec-2025
(Chart reference: 15-min | Gap criteria considered: 100+ points)
Important Levels from Chart
Opening Resistance: 25,848
Last Intraday Resistance: 25,923 – 25,951
Upper Target / Supply: 25,985
Opening Support (No-Trade Zone): 25,763 – 25,814
Last Intraday Support: 25,677 – 25,703
Extreme Support: 25,594
🟢 1. GAP-UP OPENING (100+ Points)
If NIFTY opens above 25,848, it directly enters the overhead resistance structure.
🎓 Educational Explanation:
A gap-up opening indicates overnight positive sentiment, but price often reacts near prior supply zones due to profit booking. Professional traders avoid chasing and instead wait for acceptance above resistance or a healthy retest.
Plan of Action:
Sustaining above 25,848 for 10–15 minutes can allow pullback-based long entries.
First upside hurdle is 25,923–25,951 (last intraday resistance zone).
Acceptance above 25,951 may extend the move toward 25,985.
Rejection or exhaustion near 25,923–25,951 can trigger a pullback toward 25,848.
Option buyers should prefer ATM/ITM Calls only after confirmation; avoid buying at the opening spike.
🟡 2. FLAT OPENING
A flat open near 25,800–25,830 places NIFTY inside the Opening Support / No-Trade Zone.
🎓 Educational Explanation:
Flat opens represent market indecision. During such phases, price tends to trap early buyers and sellers. Direction becomes clear only after a range breakout or breakdown, making patience crucial.
Plan of Action:
Break and sustain above 25,848 shifts momentum toward 25,923–25,951.
Failure to cross 25,848 keeps price vulnerable to a downside test.
Breakdown below 25,763 opens downside toward 25,703–25,677.
Watch for bullish reversal patterns near 25,763–25,814 for bounce trades.
🔴 3. GAP-DOWN OPENING (100+ Points)
If NIFTY opens below 25,763, selling pressure may dominate early.
🎓 Educational Explanation:
Gap-down openings are often driven by fear. However, strong historical demand zones usually attract buyers looking for value, leading to short-covering bounces. Selling blindly at support increases risk.
Plan of Action:
First demand zone to observe is 25,703–25,677; look for rejection or base formation.
A bounce from this zone can retrace toward 25,763–25,814.
Sustained breakdown below 25,677 exposes the 25,594 level.
Any pullback toward 25,763 after breakdown becomes a selling-on-rise opportunity.
⚙️ Risk Management Tips for Options Traders 🛡️
Avoid trading in the first 5–10 minutes during gap days.
Do not buy options near resistance or sell near support—wait for confirmation.
Use time-based stop-loss (15–20 minutes) if the premium fails to move.
Risk only 1–2% of total capital per trade.
Prefer ATM options or vertical spreads to manage theta decay.
Book partial profits near marked resistance/support zones.
🧾 Summary & Conclusion
Above 25,848: Bulls stay active with targets 25,951 → 25,985.
Between 25,763–25,848: Market remains range-bound; patience is key.
Below 25,763: Sellers gain control unless buyers defend 25,703–25,677.
Focus on price behaviour at levels, not prediction.
Consistency comes from discipline, not frequent trades.
⚠️ Disclaimer
I am not a SEBI-registered analyst. This trading plan is for educational purposes only and should not be considered financial or investment advice. Please consult your financial advisor before taking any trades.

BSOFT — Double Bottom Formation | Waiting for Neckline Breakout BSOFT has gone through a sharp corrective phase and is now showing a clear double bottom structure near the demand zone.
Both lows were defended strongly, and price has started to move back toward the neckline resistance around the highlighted level.
Right now, the stock is at a decision point.
• A clean breakout and hold above the neckline would confirm the pattern and open the door for the next upside leg.
• Until that happens, patience matters — no anticipation, only confirmation.
This study is purely based on price behavior, structure, and reactions, not predictions or hype.
I prefer to wait for price to prove itself before taking any action.
Quality setups > random trades.

NIFTY Levels for Today
Here are the NIFTY's Levels for intraday (in the image below) today. Based on market movement, these levels can act as support, resistance or both.
Please consider these levels only if there is movement in index and 15m candle sustains at the given levels. The SL (Stop loss) for each BUY trade should be the previous RED candle below the given level. Similarly, the SL (Stop loss) for each SELL trade should be the previous GREEN candle above the given level.
Note: This idea and these levels are only for learning and educational purpose.
Your likes and boosts gives us motivation for continued learning and support.

Nifty Option Trade NIFTY 25800 CE
Dec Month
Cmp 178
Enter 1 LOT NOW
2nd Near 145
SL 120
Expected Tgts 190-220-245-270
TSL MUST
Trade will Fail if Nifty Spot sustains below 25690

XAU/USD: Price shifts from Supply, eyeing liquidity draw◆ Market Context (H1)
Gold is maintaining a medium-term uptrend, however, the price has reacted at the Supply Zone ~4,350 and started to adjust. The current decline is a technical pullback, with no signal of a main trend reversal.
◆ SMC & Price Action
• The upward structure remains valid as higher lows are maintained.
• Price is leaving the Supply Zone and may return to the Liquidity Buy + Fibo areas below.
• The upward trendline still acts as dynamic support for the recovery.
• No clear bearish CHoCH has appeared → prioritize the trend continuation scenario.
◆ Key Levels
• Supply / resistance: 4,350
• Liquidity Buy + Fibo: ~4,299
• Support Zone – Buy: 4,276
• Invalid upward structure: clear break of 4,276
◆ Trading Scenarios
➤ Scenario A – Pullback BUY (priority)
• Wait for price to return to Liquidity Buy + Fibo ~4,299
• Condition: price holding reaction, rejection candles
• Targets:
▪ 4,325
▪ 4,350 (Supply)
➤ Scenario B – Deeper Pullback
• If 4,299 is breached
• Monitor Support Zone 4,276 for buying reaction
• Only BUY if structure is preserved
➤ Scenario C – Break & Continue
• If price does not pull back deeply and holds above 4,325
• Follow the uptrend towards 4,350
• Manage risk at Supply
◆ Summary
• Main trend: Bullish (pullback within uptrend)
• Decision area: 4,299 → 4,276
• Upper target: 4,350
• Avoid SELL against the trend without a bearish CHoCH.
